Psilocybin Potency Variation
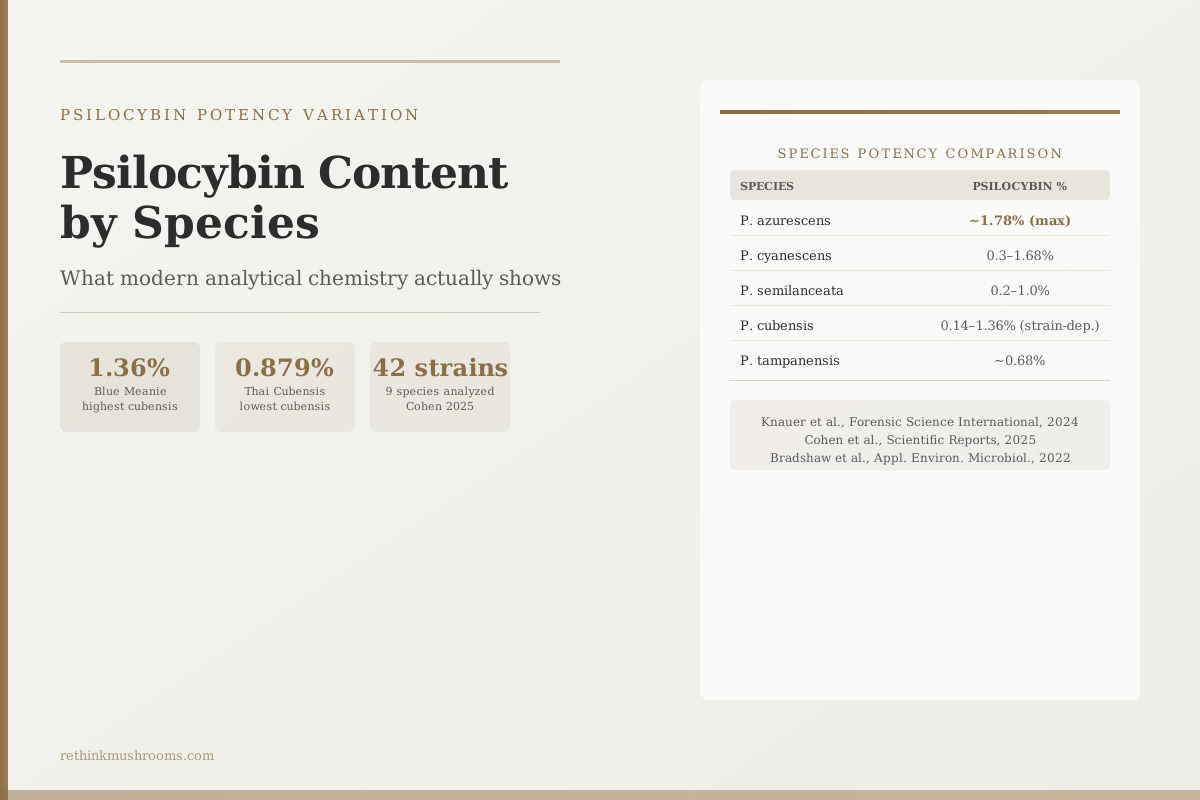
1.36% total psilocybin + psilocin by dry weight: the Creeper P. cubensis strain, the highest of five strains measured in the most precisely calibrated modern multi-strain analysis
Five P. cubensis strains analyzed with calibrated LC-MS/MS standards ranged from 0.879% to 1.36% total psilocybin + psilocin, a 1.55-fold variation within a single species under controlled conditions. Real-world variation is wider.
Goff et al., Analytica Chimica Acta, 2024
0.879%
Thai Cubensis strain, the lowest in the same Goff 2024 analysis; the 1.55x within-species range understates real-world variation which is substantially larger
42 strains
across 9 psilocybin-producing species analyzed by Cohen et al. 2025; each strain produced a unique metabolite fingerprint, undermining simple potency rankings
0 alkaloids
detected in some museum-archived Psilocybe specimens; historical potency tables are built on data like this, often from decayed or misidentified samples (Bradshaw 2022)
Goff et al., Analytica Chimica Acta, 2024
 View as image ↗
The species potency tables circulating across mushroom identification sites all share one problem: most of them trace back to measurements made on museum herbarium specimens, often decades old, using analytical methods that have since been superseded. A 2022 DNA authentication study of 94 Psilocybe museum specimens found widespread species misdeterminations and some specimens with zero detectable psilocybin or psilocin, meaning part of the historical dataset was measuring the wrong species or fully degraded material.[3]
The more reliable data comes from a newer generation of analytical chemistry studies using calibrated liquid chromatography-tandem mass spectrometry (LC-MS/MS) with deuterium-labeled internal standards. This method produces numbers that can actually be compared across labs and studies.
This guide uses those newer measurements where they exist and flags where older data is being quoted. The broader context on how Psilocybe cubensis specifically compares to other species, including cultivation and strain factors, is in Psilocybe cubensis: The World's Most Cultivated Magic Mushroom.
Key Takeaways
- Most published species potency tables use historical herbarium data; Bradshaw et al. 2022 found that some museum Psilocybe specimens contain zero detectable alkaloids due to decay or misidentification, making these historical data tables fundamentally unreliable
- Goff et al. 2024 measured 5 P. cubensis strains with calibrated LC-MS/MS and found, by total psilocybin + psilocin, Creeper at 1.36%, Blue Meanie at 1.221%, B+ at 1.134%, Texas Yellow at 1.103%, and Thai Cubensis at 0.879%, a 1.55-fold range within one species under controlled lab conditions
- Cohen et al. 2025 analyzed 42 strains across 9 psilocybin-producing species and found that each strain produces a unique metabolite fingerprint; strains cannot be treated as a cohesive group, and species name alone does not reliably predict psilocybin content
- P. azurescens consistently appears at the high end of reported potency (~1.78% psilocybin in the original description), while P. cubensis sits in the mid-range; P. tampanensis is typically lower
- The real-world variation from wild-sourced or different-batch samples is substantially larger than controlled lab measurements suggest; even within a single flush, individual mushrooms can vary significantly
- Kurzbaum et al. 2025 identified that P. cubensis strain differences arise from both genetic factors (psilocybin biosynthesis gene cluster regulation) and cultivation conditions, with research gaps around the genetics of individual strain variation noted explicitly
Why Published Potency Tables Are Often Wrong: The Data Problem
Before presenting what the modern evidence actually shows, it's worth understanding why the numbers on most existing potency comparison pages are not trustworthy.
The original species-level potency data for most Psilocybe species was measured from one of three problematic sources: museum herbarium specimens (dried and stored for years or decades), samples contributed by field collectors without confirmed provenance, or early analytical methods (thin-layer chromatography, early HPLC) that lacked the precision of modern LC-MS/MS.
Bradshaw and colleagues, in a 2022 study in Applied and Environmental Microbiology that authenticated 94 Psilocybe fungarium specimens using DNA barcoding, found two major problems with that historical dataset.[3] First, widespread species misdeterminations: specimens labeled as one Psilocybe species were frequently a different species entirely when DNA-tested. Second, alkaloid decay: psilocybin and psilocin showed time-dependent degradation in stored specimens, and some specimens had no detectable alkaloids at all. A table built on those measurements is measuring the wrong species or measuring a compound that is no longer there.
Fact Check
Are the widely-shared species potency tables reliable?
The claim
“Standard online potency tables give a fixed, trustworthy psilocybin percentage for each Psilocybe species.”
Most circulating tables trace back to measurements on museum herbarium specimens and early analytical methods, then get copied across identification sites.
What research shows
MisleadingBradshaw et al. 2022 DNA-barcoded 94 fungarium specimens and found that taxonomic determinations were largely unreliable even at the genus level, with psilocybin and psilocin showing taxon- and time-dependent decay — some specimens had no detectable alkaloids at all.
Modern calibrated analyses (Goff 2024; Cohen 2025) give numbers you can trust as measurements, but they confirm that within-species variation is large enough that no single percentage represents a species.
Bradshaw et al., Applied and Environmental Microbiology, 2022 (PMID 36445079)
Modern analytical chemistry papers use calibrated standards to address the measurement precision problem. Goff and colleagues, in a 2024 study in Analytica Chimica Acta, used deuterated internal standards (isotopologues of each analyte) for their LC-MS/MS analysis of five P. cubensis strains, allowing them to correct for extraction efficiency variation and produce numbers that represent actual alkaloid content rather than measurement artifacts; they reported percent error and relative standard deviation below 6% at all concentration levels, and a subset re-tested at a separate non-affiliated laboratory returned comparable results.[2]
Cohen and colleagues, in a 2025 Scientific Reports study analyzing 42 fungal strains across 9 psilocybin-producing species, confirmed that even with modern analytical methods, the metabolite profiles of different strains are so individually distinct that treating any species or strain as a stable potency category is scientifically unjustified.[1]
The Best Available Data: Species Potency Ranges from Published Analysis
The following table represents the published analytical ranges for the most commonly encountered psilocybin-producing species. Values reflect dry weight percentages from available primary literature, with caveats noted. Where only older data exists, the historical figures are presented with that context explicitly stated.
| Species | Psilocybin (% dry wt) | Relative potency vs. typical P. cubensis | Data quality |
|---|---|---|---|
| P. azurescens | ~1.78% (max reported) | ~3–4x | Original description data; limited corroboration |
| P. cyanescens | 0.3–1.68% | 0.5–3x | Multiple analyses; high within-species range |
| P. semilanceata | 0.2–1.0% | 0.3–2x | Multiple analyses; mid-range typical |
| P. cubensis | 0.14–1.36% | 1x (reference) | Best-studied; Goff 2024 calibrated data |
| P. tampanensis | ~0.68% | ~1x | Limited analyses; sclerotia form primary |
The ranges for each species are wide. This is not imprecision in measurement: Cohen et al. 2025's analysis of 42 strains confirmed that within any given species, metabolite profiles are highly individualized.[1] A P. cyanescens specimen at 0.3% and one at 1.68% are both correctly identified as the same species while differing five-fold in psilocybin content. The species label tells you the genus-level expectation; it does not reliably predict what a given specimen contains.
For P. azurescens specifically: the 1.78% figure comes from the original 1996 species description and is not corroborated by a large body of independent calibrated measurements. It represents an extreme, not a typical value. In practice, P. azurescens is rarely cultivated (it requires outdoor wood chip beds in a specific climate zone), meaning most psilocybin from P. azurescens is wild-sourced and therefore subject to all the variability caveats that apply to uncontrolled samples.
Inside P. cubensis: The 1.36% to 0.879% Range Between Strains
Psilocybe cubensis is the most studied species because it is the most widely cultivated. That makes it the species for which the best analytical data exists.
Goff and colleagues' 2024 calibrated LC-MS/MS analysis of five commonly grown strains found the following concentrations, reported as total psilocybin plus psilocin (percent of dry weight, w/w):[2]
- Creeper: 1.36%
- Blue Meanie: 1.221%
- B+: 1.134%
- Texas Yellow Cap: 1.103%
- Thai Cubensis: 0.879%
The spread from lowest to highest was 1.55-fold under controlled laboratory conditions. This is the within-species range when growing conditions are standardized. (Goff measured three whole, intact mushrooms from each strain individually, so these averages also capture mushroom-to-mushroom variation within a single strain, not just between strains.)
Three points are worth holding alongside those numbers. First, Goff 2024 used only five strains from what is a much larger universe of P. cubensis varieties; other strains may fall outside this 1.55x window. Second, the lab conditions in analytical chemistry studies are not representative of real-world cultivation, where substrate variation, humidity fluctuations, and timing differences introduce additional variation beyond what these numbers show. Third, Bradshaw 2022 found some historical herbarium specimens of P. cubensis with zero detectable alkaloids, meaning even within P. cubensis, the worst-case variation is total absence of measured alkaloids in degraded material, which is far outside the Goff 2024 range.[3]
Goff et al. (2024) · Analytica Chimica Acta
- Population
- Five dried, intact P. cubensis strains (Creeper, Blue Meanie, B+, Texas Yellow, Thai Cubensis); three whole mushrooms analyzed per strain
- Intervention
- Calibrated LC-MS/MS quantification of psilocybin and psilocin using deuterated internal standards
- Finding
- Average total psilocybin + psilocin ranged from 1.36% (Creeper) to 0.879% (Thai Cubensis), a 1.55-fold spread within one species under controlled conditions. Percent error and RSD were below 6% at all levels; a non-affiliated second laboratory returned comparable results.
narrow-scope Rigorous and reproducible, but only five cultivated strains under lab conditions — not a map of real-world or wild-sourced variation.
Goff et al., Analytica Chimica Acta, 2024 (PMID 38220293)
The detailed comparison of specific P. cubensis varieties, including Golden Teacher, B+, and Penis Envy, is in Psilocybe cubensis varieties: Golden Teacher, B+, and Penis Envy compared. For a deep dive specifically on what the cubensis content data shows, see psilocybin content in P. cubensis: how much is actually there?.
42 Strains, 9 Species: Why Each One Has a Unique Chemical Fingerprint
Cohen and colleagues' 2025 Scientific Reports study is the most comprehensive multi-species metabolite analysis published to date.[1] Optimizing a standardized extraction and chromatographic method, they characterized the metabolomes of 42 psilocybin-producing fungal strains across 9 species and quantified 8 tryptophan-derived indolamines by HPLC-DAD. Their central finding was that the breadth and diversity of metabolites varies substantially both within and between species: species identity shapes the metabolite profile, but individual strains within a species are not interchangeable. The same species name can correspond to meaningfully different chemical outputs.
The finding extends to unexpected compounds. Cohen 2025 identified putative hydroxypsilocybin by HPLC-MS/MS among the 42 strains analyzed, a metabolite not routinely characterized in standard potency work.[1] This illustrates the broader point: the psilocybin content measured in a species (or strain) is not the complete picture of what that species produces. The full metabolite landscape includes compounds that most analytical methods do not measure and most potency tables do not consider.
For the reader asking "which species should I expect to be strongest?": the honest answer from this data is that species-level expectations are directional, not predictive. P. azurescens is consistently associated with higher potency than P. cubensis. But the within-species variation in both species is substantial enough that a low-potency P. azurescens specimen and a high-potency P. cubensis specimen can overlap. The species name gives a probability, not a measurement.
What Drives the Differences: Genetics and Environment Together
Kurzbaum and colleagues, in a 2025 Journal of Fungi review of P. cubensis strain diversity, identified that psilocybin content differences between strains arise from two interacting sources: genetic variation in the biosynthesis gene cluster and cultivation conditions.[4]
The genetic side: the four enzymes responsible for synthesizing psilocybin from tryptamine (PsiD, PsiK, PsiM, PsiH) are encoded in the psilocybin gene cluster, and variation in how that cluster is regulated between strains affects enzyme expression levels, which directly affects how much psilocybin each cell produces. The molecular basis for why one P. cubensis strain consistently outperforms another in psilocybin content is, at its root, a gene expression difference.
The environmental side: even a genetically "high-potency" strain can produce low alkaloid content under suboptimal conditions. Substrate composition, temperature, light exposure, and humidity all affect enzyme activity and therefore psilocybin yield. Kurzbaum 2025 reviews the research gaps here, noting that precisely how each cultivation variable interacts with biosynthesis gene expression is not fully characterized for most strains.[4]
The practical implication is that a potency number measured in one analytical study (even a well-executed modern one like Goff 2024) reflects those specific mushrooms, grown under those specific conditions. The number is an accurate measurement of what was in those samples. It is not a stable characteristic of the strain or species that generalizes to all specimens of that type.
The underlying biosynthesis pathway that all these species share is covered in how mushrooms make psilocybin: the biosynthetic pathway. The reasons potency varies even within identical-looking mushrooms from the same batch are in why psilocybin potency varies so much between mushrooms and why psilocybin content varies 4x between identical-looking mushrooms.
Safety
CriticalPotency numbers are not a dosing guide
Concern
Because psilocybin content varies more than 1.5-fold between strains of one species and far more once wild-sourcing, storage, and growing conditions are added, no published table can tell you how much active compound is in a specific mushroom. The same nominal species can range from near-zero to over 1% depending on the individual specimen.
What the research says
Treat every figure in this guide as a directional estimate for understanding the science, not a measurement of any mushroom you might encounter. Species misidentification is also common and can be dangerous, since some toxic mushrooms resemble psilocybin-producing species.
Particularly relevant for: Anyone using these numbers to estimate real-world content
What to do
This article is educational and is not medical, dosing, or legal advice. Psilocybin is a controlled substance in most jurisdictions; consult applicable laws and a qualified professional before acting on anything here.
Bradshaw et al. 2022; Cohen et al. 2025; Goff et al. 2024
The Bottom Line
Published psilocybin potency tables should be treated as directional estimates rather than reliable measurements. Bradshaw 2022 demonstrated that the historical data is compromised by misdetermination and alkaloid decay. Modern calibrated analyses (Goff 2024 for five cubensis strains; Cohen 2025 for 42 strains across 9 species) provide more reliable numbers but confirm that within-species variation is substantial. The Creeper P. cubensis strain measured at 1.36% total psilocybin + psilocin while Thai Cubensis measured at 0.879% in the same controlled study. P. azurescens remains the highest-potency species by available data, but reliable modern measurements for wild species are limited. Cohen 2025's finding that each strain produces a unique metabolite fingerprint suggests that species-level potency rankings are useful only as rough guides.
Frequently Asked Questions
Sources & References
- 1RTHM-02069·Cohen, Jonathan et al. (2025). “Comprehensive analysis of 42 psilocybin-producing fungal strains reveals metabolite diversity and species-specific clusters..” Scientific reports.Study breakdown →PubMed →↩
- 2RTHM-00879·Goff, Roman et al. (2024). “Determination of psilocybin and psilocin content in multiple Psilocybe cubensis mushroom strains using liquid chromatography - tandem mass spectrometry..” Analytica chimica acta.Study breakdown →PubMed →↩
- 3RTHM-01490·Bradshaw, Alexander J et al. (2022). “DNA Authentication and Chemical Analysis of Psilocybe Mushrooms Reveal Widespread Misdeterminations in Fungaria and Inconsistencies in Metabolites..” Applied and environmental microbiology.Study breakdown →PubMed →↩
- 4RTHM-00932·Kurzbaum, Eyal et al. (2025). “Exploring Psilocybe cubensis Strains: Cultivation Techniques, Psychoactive Compounds, Genetics and Research Gaps..” Journal of fungi (Basel.Study breakdown →PubMed →↩